Smart mobility projects involve data chains. Data chains are often represented as neat, ordered sequences of activities. Those representations communicate dedication and control, but neglects important governance aspects of data interchange. For evaluation of smart mobility a more sophisticated representation is vital.
Key words: data chains, variety, serendipity, communication, evaluation
‘Everything should be made as simple as possible, but not simpler.’ Einstein’s aphorism also applies to data platforms for intelligent mobility. Sharing data is in the abstract simple, since programmable, generally represented as a conveniently arranged chain of activities. Arena c.s. (2012) specifies five successive activities, adopted by ISO: from data acquisition, data processing and data communication to information distribution and information utilization.
More than often, these data chains easily involve more than two actors, including providers, users and intermediaries. A simple data chain for mobility data platoforms involves data providers, the platform owner and manager, providers of related applications and users. Ideally, representations of those data chains, combined with the many actors involved, look as neat and structured as the figure below, where the blocks are actors and the arrows the data.
Figure 3: simple data chain representation
Our cases, however, suggest that this representation is fairly oversimplified and does not reflect the governance complexity in mobility data platforms. It assumes a number of stable factors that, alas, should be considered quite questionable.
A single source. Obviously, the added value of a platform is integrating different data sources. In any case, the sources are pluriform and the respective data providers are multiple and diverse. For example, bus feeds for Plan a Journey are automatically imported, while their tube data first passes the back office system that tests all data accuracy before it is included in the platform. Next to that, smaller modes have their data provided in excel files and this information is manually inserted in the platform. National railway provides blocks of data weekly. All these different sources and procedures require separate handling. CarFreeAtoZ also has an interesting example of multiple sources. Several transport operators from different jurisdictions (Virginia, DC, Maryland) provide info to be used in the platform.
Optimod in Lyon is the opposite: all information is produced/collected by a single transport operator Keolis Lyon. Nonetheless, there is an intermediary between the data producer and the platform manager: Sytral, the transit authority.
A single goal. Most representations of data chains presume a single process that serves a single goal. Each link provides added value to a targeted end user. Each link enriches the data, at least by processing data towards the eventual user. Platforms typically consider their whole chain as dedicated to the desires of the end user. However, any platform that nudges, also presumes that there is conflict of interest between the traveller and the public services trying to nudge travellers. In software used by Reittopas, for example, the conflict is to weigh green travel options against faster options.
A single approach. For the data chain to be as clear and streamlined as the figure above, it is interesting to see that even if we take a single user with a single goal, we still meet many different approaches to contribute to that goal. For the same type of user and for the same type of goal, we see MAAS building its business case on a perceived users’ wish of purchasing mobility in one time – a one stop shop. Qixxit is working towards such a one stop shop as well. Other platforms consider it wise to let the user make its own choices, only presenting several consequences of a travel choice, for instance in terms of time, amount of transits and CO2-emissions.
A single sequence of activities. The figure also assumes a single sequence of activities, but this neglects the dynamics of mobility data platforms. It may be wishful thinking or a reconstruction in hindsight. In foresight, data are generally not gathered and collected for the eventual use in this platform. For example, data of telecom-providers may be useful, but they are not collected for mobility data platforms in cities. The intention of data processing may change over time. A major consequence is serendipity. Gathering and processing data becomes a group of loosely coupled, goal-searching activities.
A single platform. The simple representation suggests that there is just one platform. In reality, there are many. Qixxit first concentrated on train travel through Germany, partly because there already existed platforms for German cities. This means that data streams are not always dedicated to a single platform.
If these extra complexities are included, the picture of the data chain would look like this.
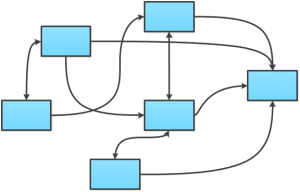
Figure 4: A real world representation of data chains
Of course, such a picture doesn’t communicate what mobility data platforms initiatives want to communicate. They want to show dedication and control. However, for anyone who wants to evaluate an initiative – either ex ante or ex post – the second picture may be a better guideline.